(1).jpg)
Geographic Atrophy & Patients With GA
Geographic atrophy (GA), is an advanced form of age-related macular degeneration (AMD), affecting the retina, a part of the eye that sends information to the brain to enable sight.
Many people with AMD do not immediately recognise the symptoms, mistaking them for normal signs of ageing, which leads to more severe vision loss.
There are currently no treatments available to slow the progression of GA. Clinical trials are underway for potential GA treatments. Low vision aids like magnifiers or special eyeglasses may also be prescribed.
In the literature, wet and dry age-related macular degeneration (AMD) has been associated with decreased mobility and driving ability. Patients with advanced dry AMD, also called geographic atrophy (GA), also might report reduced ability to read, social isolation, and inability to maintain personal hygiene.
Patients note diminished confidence with commonplace tasks they performed before disease progression. For example, among patients with GA who have a driver’s license, 50% have reported a lack of confidence with daytime driving and 88% have reported a lack of confidence with nighttime driving.
Given its effect on the quality of life, patients rank severe (VA ≤ 20/200) and very severe (VA ≤ 20/800) vision loss due to AMD among the worst diseases. They compare such vision loss to home dialysis, uncontrollable pain due to cancer, and even stroke resulting in permanent bedridden status.
It is estimated that more than 3.5 million patients in the United States will have AMD by the year 2030; that number is estimated to rise to 5 million by 2050.
As the number of patients in clinics increases in the coming decades and as we, hopefully, have treatments for GA, it will be important to understand how the disease is classified, how disease progression is quantified, and the best ways to assess visual loss due to GA.
This will allow us to study the effects and outcomes of the potential therapeutics and identify patients at highest risk of progression who might benefit the most from early interventions.
Classification and Risk Factors for GA
The Beckman Initiative for Macular Research Classification Committee categorized AMD into four stages: (1) no AMD; (2) early AMD; (3) intermediate AMD; (4) and advanced AMD. The two forms of advanced AMD are neovascular AMD (also called wet AMD) and GA.
A patient is classified as having no AMD when no pigmentary abnormalities are observed and no or only few drupelets (≤ 63 µm drusen) are detected. Patients with early AMD show no pigmentary changes and demonstrate drusen between 63 µm and 125 µm in size .
When at least one drusen greater than 125 µm is observed, or when pigmentary changes are seen, a patient has intermediate AMD. (In the clinic, it may be useful to use the central retinal vein for measuring drusen, as this vein is approximately 125 µm.)
Central vision loss associated with macular damage is the hallmark of advanced AMD. If neovascularization is observed, then the patient is diagnosed with wet AMD. Patients with GA demonstrate loss of photoreceptors, thinning the retinal pigment epithelium (RPE) and choriocapillaris layers, and resultant dense scotomas.
Smoking history and age have been tied to GA development. A history of 40 pack-years of cigarettes has been tied to a 3.4-fold increase of risk of GA development. Patients who are older than 90 have a significantly higher prevalence of GA compared with those who are 84 and younger.
Risk factors for development of AMD in general include family history of AMD, smoking history, obesity, and hypertension.
Clinical Presentation
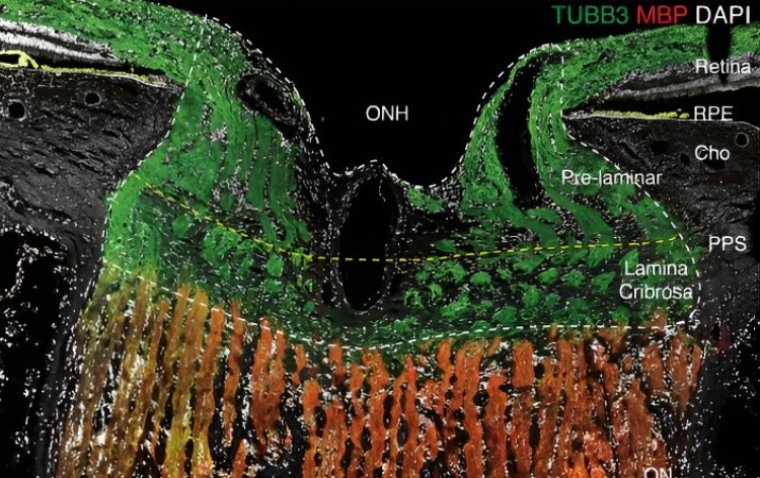
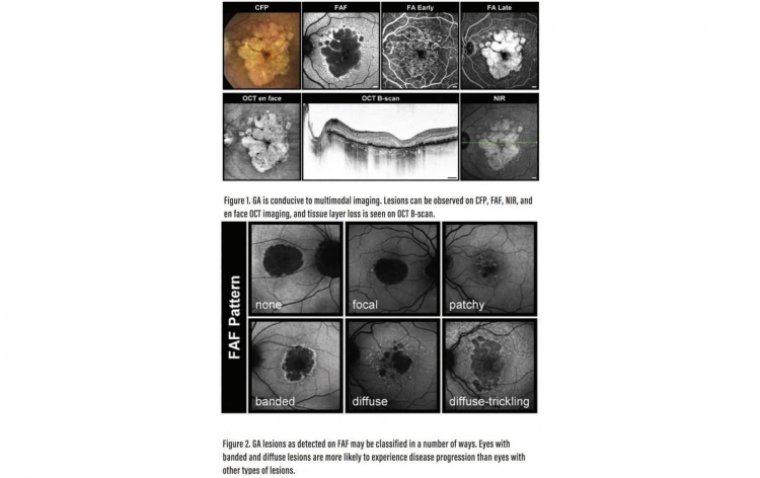
GA can be observed on a number of imaging modalities (Figure 1). Imaging reports may be handy tools for educating patients and their family about disease progression, identifying patients who are at highest risk for progression, and also for assessing the effects of potential therapeutics.
The most commonly used imaging modalities in clinical practice and research are optical coherence tomography (OCT), color fundus photography (CFP), and fundus autofluorescence (FAF). The role of other imaging modalities such as OCT angiography and confocal nearinfrared reflectance is being investigated. B-scan OCT imaging is what most physicians use in clinic.
It depicts loss of outer retinal layers corresponding to the RPE and photoreceptors. En face OCT imaging can be used to educate the patients in clinic environment. CFP has been used in earlier clinical studies with FAF being a current go-to modality to assess GA.
CFP shows sharply demarcated hypopigmented unifocal or multifocal areas with sometimes visible larger choroidal vessels due to the absence of the RPE and the choriocapillaris. Progression usually begins in the extrafoveal region and proceeds in a horseshoe pattern until the lesion is donut shaped.
Foveal involvement of lesions usually occurs in the final stage of progression. Imaging of GA lesions will be valuable in identifying patients at highest risk of progression and when tracking the anatomic outcomes of future treatments.
Natural history studies have determined that the rate of lesion progression in GA patients ranges from 0.53 mm2 to 2.6 mm2 per year (median 1.78 mm2 ). Risk factors for faster progression include larger baseline lesion size, extrafoveal lesions, multifocal lesions, fellow eye GA, as well as some FAF patterens.
On FAF, hypoautofluorescent areas indicate GA lesions. The lesions can have different configurations and borders or junctional zones around the lesions can be hyperautofluorescent. Different FAF patterns have been implicated as risk factor for GA progression.
Holz et al found that patients with GA whose lesions were classified as banded or diffuse trickling were more likely to experience disease progression compared with those whose lesions fit other classifications.
Increased FAF as seen in the junctional zone of GA can be classified as focal, patchy, banded, or diffuse, with diffuse-trickling being one of the diffuse patterns (Figure 2). Patients with focal lesions show evidence of one or more small spots of elevated FAF at a lesion’s edge, while lesions that show some FAF spots outside the GA area are classified as patchy.
Banded patterns are defined as having central hypoautofluorescence with a hyperautofluorescent border surrounding the entire lesion. Patients with diffuse lesions show evidence of FAF spots outside the GA lesion area, with spread toward the posterior pole.
Lesions that demonstrate gray (rather than black) hypoautofluorescence and lobular atrophic patches with high intensity at the margins are classified as diffuse-trickling.
Measuring Visual Loss
The standard Snellen best corrected visual acuity (BCVA) may be an inadequate measurement of visual function in patients with GA due to the foveal-sparing nature of the disease.
It does not represent the patient visual experience and assessing the efficacy of future treatments for this disease will require use of alternative visual assessments, such as microperimetry, low luminance visual acuity (LLVA), reading speed assessment, and patient-reported outcomes.
Microperimetry
Microperimetry measures threshold light sensitivity at multiple points over the macula. During a microperimetry test, patients press a button to acknowledge perception of a stimulus. A sensitivity map can be obtained by modifying the stimulus intensity.
Visual field sensitivity reports from microperimetry test can be overlaid atop CFP and other imaging modalities, leading to an understanding of the relationship between anatomy and function.
Low Luminance Visual Acuity Given that GA patients often have significant visual impairment in dimly lit settings, use of LLVA may be a reliable metric of disease progression and disease impact on visual acuity.
During an LLVA assessment, a patient reads a normally illuminated ETDRS chart through a 2.0-log unit neutral density filter placed over the best correction for their eye. Sunness et al found that baseline low luminance deficit was a strong predictor of subsequent vision loss for all levels of baseline VA in patients with GA.
They also found that use of LLVA could identify patients who are at the highest risk for VA loss due to GA. Reading Speed Assessment Patients with extrafoveal GA lesions may be able to see single letters on a traditional eye chart because a single letter may fall within the foveal region.
To this end, asking a patient to read an entire sentence may be a more accurate measure of visual function. These reading speed evaluations could expose a decline in visual function due to parafoveal atrophic areas.
Patient-Reported Outcomes
The National Eye Institute Visual Function Questionnaire 25 (NEI VFQ-25) is one of the examples of an assessment by which patients may report practical visual function.
It asks questions, for example, about the ability to perform daily tasks. Sivaprasad et al found that the NEI VFQ-25 was a reliable and valid crosssectional measure of the impact of GA on patient visual function and vision-related quality of life.
Learning to Assess GA
If any of the pipeline therapies for GA achieve regulatory approval, then it will change the paradigm of how we approach our GA patients. Even now understanding how the patients’ vision affects their quality of life is important.
Given that the potential treatments may prevent GA growth and rather than reverse GA damage, it will be even more essential to know how to identify patients who will benefit most from these novel treatments and how to assess response to these treatments.